2016/01/22 TrendView VIDEO: Global View (early)
© 2016 ROHR International, Inc. All International rights reserved.
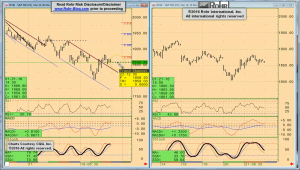
The analysis videos are reserved for Gold and Platinum Subscribers
TrendView VIDEO ANALYSIS & OUTLOOK: Friday, January 22, 2016 (early)
 Global View: All Markets
After a rather active week in the equities with further critical trend potentials looming into today’s weekly Close, it seemed important to wait until this morning to see the extended impact of ECB President Draghi’s return to a much more accommodative QE stance. While the ECB did not announce any change to the program on Thursday, the extended focus on the impact of the further major energy and commodity price slide was telling. As we noted in Thursday afternoon’s Draghi accommodatively downbeat Commentary post, he was rightfully concerned about pressure on other aspects of the economy beyond the impact of sheer lower energy prices on inflation readings: the dreaded ‘second round effects’.
While many of the more parsimonious members of the ECB Governing Council are not inclined to expand the Quantitative Easing (QE) program, there is an assumption that (much like the Fed Chair) President Draghi can prevail on other members to go along if circumstances warrant. With equities on the mend (no doubt due to Draghi’s assistance on Thursday), it will not be necessary to actually do anything now. As even he noted, there will not likely be any changes until the Council sees updated economic and financial projections in March. Yet the psychological shift was telling. That includes the weakening of the govvies on the equities rebound, at least outside of the Bund. The latter will not necessarily weaken on the equities recovery as long as the reason is European weakness.
Of course, the economic weakness extends well beyond Europe. The overall economic picture remains weak with only some occasional exceptions in the data. As an example, the UK Employment figures were strong again on Wednesday. Yet that is against a backdrop of overall UK data that has been very disappointing. And the FTSE stock index as well as the currency reflects that in the same way as struggling commodity currencies.
_____________________________________________________________
Video Timeline: It begins with macro (i.e. fundamental influences) mention of aspects noted above, and the degree to which data generally remained weak into the start of 2016. That was especially so for US housing, which had been a previous source of strength, and inflation data hit by the weakness of commodities and energy.
It moves on to S&P 500 FUTURE short-term at 02:45 and intermediate term view at 05:15 with the long term view of the monthly chart at 07:15, OTHER EQUITIES from 09:45, GOVVIES beginning at 13:00 (with the BUND FUTURE at 15:30) and SHORT MONEY FORWARDS from 17:15. FOREIGN EXCHANGE covers the US DOLLAR INDEX at 20:15, EUROPE at 22:45 and ASIA at 26:00, followed by the CROSS RATES at 28:00 and a return to S&P 500 FUTURE short term view at 31:45. We suggest using the timeline cursor.
_____________________________________________________________
Authorized Gold and Platinum Subscribers click ‘Read more…’ (below) to access the balance of the opening discussion and TrendView Video Analysis and General Update. Silver and Sterling Subscribers click ‘Read more…’ (below) to access the balance of the opening discussion.
NOTE: Back on the evening of December 8th we posted our major Extended Perspective Commentary. That reviews a broad array of factors to consider Will 2016 be 2007 Redux? For many who believe that the US economy is really strengthening and can once again lead the rest of the world to more extensive recoveries, this may seem a bit odd.
Yet there are combined factors from many areas we have been focused on since the early part of last year which are less than constructive for the global economy and equity markets. We suggest a read if you have not done so already.
We pointed out last month that in the face of another likely Santa Claus Rally this was not an actionable view during the year-end equities rally. Yet it was (and remains) important background to utilize into 2016. This is much like our major late 2006 perspective on Smooth Rebalancing? …or… The Crash of ‘07? (even though the actual crash was deferred into 2008.)
▪ That has also been reflected in the US picture deteriorating even prior to last week Friday's abysmal economic data. That included last week Monday's Organization for Economic Cooperation and Development’s latest Composite Leading Indicators (CLI.) They're typically upbeat headline could not really mask the obvious weakness spreading throughout most of the OECD area and other regions. If you have not reviewed already, it is probably worth a read.
And the headline for those latest Composite Leading Indicators (November’s indications with the typical two month delay) was indeed an upbeat “Composite leading indicators continue to point to stable growth momentum in the OECD area.” Yet even a cursory review of the actual graphs of the future economic indications shows that this is simply not the case.
The US is clearly in a cyclical downturn since as far back as late 2014, and weakening further at present. The same is true for the UK along with Japan. Of course China is still weak, and commodity economies like Canada and Russia are commensurately still suffering, even if India and Brazil might be bottoming.
While the Euro-zone seems to be recovering, as noted previous that is not of much comfort for two reasons. The Euro-zone is starting from a very low base on both economic growth and inflation, and the recent data has not been very inspiring. And in any event, we have the same question as previous on that: With so many other major economies weakening, are we really going to rely upon Europe to lead the way higher?
▪ We are going to cut right to the key market activity after Thursday’s Commentary: Draghi accommodatively downbeat post reviewed the way in which negative economic background might assist equities: it seems just for now ‘bad news is good news’ again. March S&P 500 future gapping below major trend support in the 1,865-60 range Wednesday morning was a significant additional DOWN Break. That was no nominal failure, as it was below the major weekly up channel support for the entire trend since the 666 cycle low in March of 2009. It is also not only the late September pullback low, but also a major Fibonacci 0.25 retracement (from the 1,068 October 2011 low to the highs.)
It was not very surprising that this triggered a failure below next interim supports at previous sharp selloff trading lows of 1,831 (August 2015) and 1,813 (the October 2014 Ebola epidemic trading low.) However, once it held near the 1,800 next psychological ‘big penny’ support (not really any major technical indication there) into lunchtime, it was ready to recover substantially in the afternoon. And that ended up being not just back to one of those violated incremental supports, but also all the way back up to the 1,865-60 prior to fading a bit into the Close.
What could have inspired that? Actually, we believe we’ve already mentioned it: the anticipation that all of the weakness encouraging anticipation that Signore Draghi would shift to as accommodative a stance as he took at the ECB meeting and press conference. That becoming the case early Thursday fed more friendly expectations for the equities that included the upside leader (at least having been the most ‘resilient sister’ during previous weakness) March S&P 500 future exhibiting a short-term down channel 1,859 UP Break early in the session. As it held on the afternoon setback, it left the door open to the further improvement into this morning.
It will also mean that the ostensible 1,865-60 DOWN Break will seem at least temporarily Negated at the end of this week. This sort of activity often plagues the bears in the early phase of bear markets: the sustained upside reactions that still leave the equities bearish, yet give the bears no joy. We suspect after the sharp selloff since the top of the year, that is likely the path of least resistance at least for a little while.
Higher March S&P 500 future resistances remain in the classical areas into interim 1,900, 1,925-32 and 1,958-60 areas, with the more major resistances back up at 1,970-75 and even possibly the 2,010-20 areas.
▪ Of course, that also means the upside run in the govvies will likely retrace to lower supports, even if less so in the Bund that is the object of Mr. Draghi’s economic concerns. Foreign exchange remains a mixed picture, yet with the euro suffering a bit after it recent firmness against the pound and commodity currencies. The latter are also improving a bit on the rapid rebound in Crude Oil and commodities. The question is for how long and of course, how far?
The TrendView VIDEO ANALYSIS & OUTLOOK is accessible below.
The post 2016/01/22 TrendView VIDEO: Global View (early) appeared first on ROHR INTERNATIONAL'S BLOG ...EVOLVED CAPITAL MARKETS INSIGHTS.