2016/02/03 TrendView VIDEO: Global View (early)
© 2016 ROHR International, Inc. All International rights reserved.
The analysis videos are reserved for Gold and Platinum Subscribers
TrendView VIDEO ANALYSIS & OUTLOOK: Wednesday, February 3, 2016 (early)
 Global View: All Markets
What a difference a day makes? How about what a difference a couple of hours makes! And in this case that was on the inferences the markets drew from the same indication: far more accommodative comments from typically hawkish New York Federal Reserve President Dudley. Though the equities took some initial comfort from his dovish revisionism, the extended influence was for markets to be very nervous over the possibility that the December FOMC rate hike was indeed a mistake. That said, it is probably constructive in the intermediate-term if the Fed has finally realized it is suffering from the ‘normalcy bias’ that we highlighted even prior to the December meeting, and even more intensely immediately after the rate hike announcement and projections. See our Fed’s ‘Normalcy Bias’ Continues December 16th post on that; especially the degree to which the Fed's projections for growth, inflation and interest rates were self-contradictory at that time.
Of course, all of that suspicion on the degree to which the anemic growth of the US economy needs (or will tolerate) further rate hikes was reinforced by the rather abysmal ISM Non-Manufacturing Composite release. Knowing that might be a key factor is the reason this video analysis was not even begun until an atypically later time this morning (and is being posted quite a bit later than usual.) However, that turned out to be prescient insofar as that turned out to be a much weaker indication that suspected. Especially as the services sector is supposed to be leading the US economy higher, the drop to 52.10 (a 23-month low) from 56.30 had a striking impact on all of the markets.
_____________________________________________________________
Video Timeline: It begins with macro (i.e. fundamental influences) mention of aspects noted above, and the degree to which data remained weak on balance into the start of this week. That was especially so for Manufacturing PMI’s that disappointed again out of Asia, even they were a bit more balanced on the Services side. And of course, the final decision this week will rest with Friday’s US Employment report.
It moves on to S&P 500 FUTURE short-term at 03:00 and intermediate term view at 06:30 with a look at the monthly chart as well from 09:00, with OTHER EQUITIES from 11:00, GOVVIES beginning at 15:00 (with the BUND FUTURE at 17:45) and SHORT MONEY FORWARDS from 19:30. FOREIGN EXCHANGE covers the US DOLLAR INDEX at 23:00, EUROPE at 26:00 and ASIA at 29:15, followed by the CROSS RATES at 33:00 and a return to S&P 500 FUTURE short term view at 37:00. As this is an especially extensive analysis due to our desire to wait for the ISM Non-Manufacturing Index release, even more so than usual we suggest using the timeline cursor to access the analysis most relevant for you.
_____________________________________________________________
Authorized Gold and Platinum Subscribers click ‘Read more…’ (below) to access the balance of the opening discussion and TrendView Video Analysis and General Update. Silver and Sterling Subscribers click ‘Read more…’ (below) to access the balance of the opening discussion.
NOTE: Back on the evening of December 8th we posted our major Extended Perspective Commentary. That reviews a broad array of factors to consider Will 2016 be 2007 Redux? For many who believe that the US economy is really strengthening and can once again lead the rest of the world to more extensive recoveries, this may seem a bit odd.
Yet there are combined factors from many areas we have been focused on since the early part of last year which are less than constructive for the global economy and equity markets. We suggest a read if you have not done so already.
We pointed out in December that in the face of another likely Santa Claus Rally this was not an actionable view during the year-end equities rally. Yet it was (and remains) important background to utilize in 2016. This is much like our major late 2006 perspective on Smooth Rebalancing? …or… The Crash of ‘07? (even though the actual crash was deferred into 2008.)
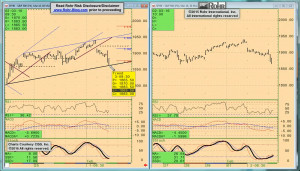
▪ The bottom line for the markets is that the March S&P 500 future weakness Tuesday morning left it slipping back from the 1,925-32 resistance, which it found so easy to test on Friday after escaping the lower resistance at 1,902-1,895. Also failing that support by Tuesday afternoon left it vulnerable to test the far more major 1,865-60 area. And in spite of the overnight strength and higher opening we suspected was dubious, it did not take very long today to swing down to once again test the top end of that lower major support.
In fact, during the process of recording the full video it went from roughly the 1,880 area down to test the top end of 1,865-60 and back up above 1,880. The completion of that volatile price swing can be seen in the return to the view of the March S&P 500 future short term charts at 37:00 (i.e. right near the end as usual.) As we note in our comment, while this was certainly not an easy price swing to manage, it is an excellent example of how knowing the key technical levels is essential; especially in volatile markets.
▪ It is obvious this is a positive backdrop for the govvies that also like the ‘bad news.’ While they were under a bit of pressure Monday, they still held near their most recently violated resistances prior to pushing up aggressively through the next higher resistances. Those include March T-note future ranging above 130-00 with the March Gilt future also pushing above 120.00-119.50. And the March Bund future not even dropping anywhere near the 162.50 it violated last week is now pushing higher toward its more major 164.00-165.00 weekly oscillator resistance.
▪ And while foreign exchange remains a more convoluted affair, the US Dollar Index reacting to the weak data and latest communication from Mr. Dudley has just today established a .9860 DOWN Break out of its near-term weekly up channel. As important, it is also below recent congestion in the .9800 area, with the .9720 mid-December trading low as the very critical next threshold. While only an intermediate-term signal, it might mean a more significant reversal of the US Dollar Index up trend is in process. We shall see.
That is very consistent with the heavily weighted euro seeing EUR/USD that held the last test of 1.0850-00 also pushing above its 1.1000 area weekly channel DOWN Break. However, here as well we have noted important secondary resistance at 1.1100-50 congestion that will act as a Tolerance on that DOWN Break. Only above that area will EUR/USD be ready to potentially push up into 1.1400-50 once again, with commensurate negative influence on the greenback.
▪ That potential extended US softening playing into the global weakness has also been reflected in the US picture deteriorating even prior to recent weaker economic data. That included last month’s Organization for Economic Cooperation and Development’s latest Composite Leading Indicators (CLI.) They're typically upbeat headline could not really mask the obvious weakness spreading throughout most of the OECD area and other regions. If you have not reviewed already, it is probably worth a read.
And the headline for those latest Composite Leading Indicators (November’s indications with the typical two month delay) was indeed an upbeat “Composite leading indicators continue to point to stable growth momentum in the OECD area.” Yet even a cursory review of the actual graphs of the future economic indications shows that this is simply not the case.
The US is clearly in a cyclical downturn since as far back as late 2014, and weakening further at present. The same is true for the UK along with Japan. Of course China is still weak, and commodity economies like Canada and Russia are commensurately still suffering, even if India and Brazil might be bottoming.
While the Euro-zone seems to be recovering, as noted previous that is not of much comfort for two reasons. The Euro-zone is starting from a very low base on both economic growth and inflation, and the recent data has not been very inspiring. And in any event, we have the same question as previous on that: With so many other major economies weakening, are we really going to rely upon Europe to lead the way higher?
And it will be that time again next week: the next set of OECD Composite Leading Indicators is scheduled for release on Monday, February 8th. It’s going to be interesting to see if anything has changed.
▪ So much else on our downbeat expectations for the global economy and equities, and commensurate resilience of the govvies remains the same as the previous analyses since early 2015. We refer you back to those observations, which remain considerably the same as previous. If you want to review the extended ‘macro’ perspectives prior to the posts noted above (i.e. observations and analysis that became more telling into last summer), there are links to those via the right-hand side bar in our Equities Summer-Fall 2015 Prismatic Evolved Trend View. That page also reviews our S&P 500 analysis through September into the later part of October with links to additional perspective.
The TrendView VIDEO ANALYSIS & OUTLOOK is accessible below.
The post 2016/02/03 TrendView VIDEO: Global View (early) appeared first on ROHR INTERNATIONAL'S BLOG ...EVOLVED CAPITAL MARKETS INSIGHTS.