2016/02/23 TrendView VIDEO: Global View (early)
© 2016 ROHR International, Inc. All International rights reserved.
The analysis videos are reserved for Gold and Platinum Subscribers
TrendView VIDEO ANALYSIS & OUTLOOK: Tuesday, February 23, 2016 (early)
 Global View: All Markets
As we have noted of late for equities, this seems like an ‘abysmal news is good news’ phase. There is little doubt that outside of a few select bright spots (mostly in the US), overall economic data has been abysmal. That continued into the top of this week on weaker Chinese MNI February Business Indicator dropping back below 50.0 once again. Other than a bright spot in French Manufacturing recovering to just above 50.0, Euro-zone advance Purchasing Managers Indices were roundly weaker than expected, as was a US Manufacturing figure. And both CBI UK Total Orders and Selling Prices were negative at well below estimates.
So what could March S&P 500 future possibly do Monday morning in the wake of all that? Well, of course, it gapped almost $20 higher on the opening to leave an early daily low five dollars above the 1,927 previous trading high of the rally from back on Thursday. That might seem truly bizarre to the casual observer. Yet those who are familiar with ‘prismatic’ central bank influences understand these ‘bad news is good news’ phases.
The market activity we are witnessing is completely reasonable under the current circumstances. That is due to the concerns over the US Federal Reserve monetary policy being out of synchronization with the other global central banks. Suffice to say for now that this is having the effect of encouraging the equities through fresh perceptions the FOMC might be constrained to limit (or even eliminate) any further planned rate hikes that would have been part of its ‘normalcy bias’ (see our December 16th post on the Fed’s ‘Normalcy Bias’ Continues for more on that from right after the FOMC meeting.)
_____________________________________________________________
Video Timeline: It begins with macro (i.e. fundamental influences) mention of aspects noted above, and the degree to which data remained weak on balance through all of last week right into early this week (except a few bright spots.) That was especially so for very weak German IFO expectations this morning even if the ‘current indications were good. More important later this week are US Durable Goods on Thursday and G20 on Friday.
It moves on to S&P 500 FUTURE short-term at 02:15 and intermediate term view at 05:15, with OTHER EQUITIES from 07:15, GOVVIES beginning at 12:15 (with the BUND FUTURE at 15:45) and SHORT MONEY FORWARDS from 18:15. FOREIGN EXCHANGE covers the US DOLLAR INDEX at 21:00 EUROPE at 22:15 and ASIA at 25:15, followed by the CROSS RATES at 30:00 and a return to S&P 500 FUTURE short term view at 33:45. As this is an especially extensive analysis due to our desire to review the impact of the weaker economic data and central bank influence at some points, even more so than usual we suggest using the timeline cursor to access analysis most relevant for you.
_____________________________________________________________
Authorized Gold and Platinum Subscribers click ‘Read more…’ (below) to access the balance of the opening discussion and TrendView Video Analysis and General Update. Silver and Sterling Subscribers click ‘Read more…’ (below) to access the balance of the opening discussion.
NOTE: Back on the evening of December 8th we posted our major Extended Perspective Commentary. That reviews a broad array of factors to consider Will 2016 be 2007 Redux? For many who believe that the US economy is really strengthening and can once again lead the rest of the world to more extensive recoveries, this may seem a bit odd.
Yet there are combined factors from many areas we have been focused on since the early part of last year which are less than constructive for the global economy and equity markets. We suggest a read if you have not done so already.
We pointed out in December that in the face of another likely Santa Claus Rally this was not an actionable view during the year-end equities rally. Yet it was (and remains) important background to utilize in 2016. This is much like our major late 2006 perspective on Smooth Rebalancing? …or… The Crash of ‘07? (even though the actual crash was deferred into 2008.)
▪ And a bit of a capitulation occurred last Thursday morning when normally hawkish St. Louis Fed President James Bullard was saying it would be ‘unwise’ for the Fed to raise rates further in the current environment. Of course, that is right and with the temporary stall out at the top of the rally last Wednesday through Friday on some aspects of US economic data that were stronger-than-expected. And here we are early this week with the equities higher in the wake of all that weak international data.
▪ This all reminds us of last September into October. After the mid-September FOMC meeting and Chair Yellen press conference the equities were under sustained pressure into the end of the month. This was once again due to the Fed’s indications things were ‘normalizing’; and back at that time its ‘normalcy bias’ was also maintained even after the US data also weakened. In spite of all the incoming weakening economic evidence, various members of the Fed’s extensive minions restated it was going to raise rates into that weakening global economic situation.
However, the economic data was so weak by the end of September that the equities actually began to stabilize. And then a funny thing happened: right into the very beginning of October, the weak data encouraged the equities on the major ‘prismatic’ psychological shift into an ‘abysmal news is good news’ market. And we revert to that terminology again because nothing could have been more abysmal than the early October US Employment report showing a gain of only 142,000 jobs in September versus a 203,000 estimate.
The December S&P 500 future response? Open and trade more than $30 lower into 1,883, yet recover to post a $26 higher Close at 1,943. And of course, that initiated the entire late year rally that carried back up into the 2,100 area.
▪ We do not necessarily believe the current rally can do anywhere near that well, as the global situation is a lot less hopeful than it was back into the end of last year. And while we will have more to say on the deterioration of the fundamental situation soon, it is more important this morning to revisit the key market tendencies.
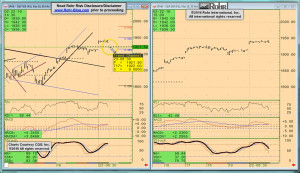
The March S&P 500 future ability to recover back above the major 1,865-60 area was very important. Last Tuesday’s ability to post an 1,886 UP Break out of its short-term trend channel resistance was also telling, as it encouraged a push above 1,895-1,902 resistance all the way into the 1,925-32 range. And while it appeared to be stalling at the low end of that area from the middle of last week, Monday morning’s gap above it that also Negated the aggressive near term up channel 1,922 DOWN Break reinvigorates the equities.
Next resistances are into 1,950, 1,958-62 and the more prominent 1,970-75 area. However, if it drops from here, it is more likely rolling over for a test of the lower supports at the violated resistance areas noted above.
Of course, we knew all of the negative fundamentals would be a positive backdrop for the govvies in spite of their weakening from the extreme highs of the ‘haven’ bid squeezes into two week s ago Thursday. As noted in the Market Observations which were updated Sunday evening in Friday morning’s Global View post (below the video analysis), govvies also like the ‘bad news.’ While they were under a bit of pressure into early this week, the recently violated resistances like March T-note future 130-00/129-16 and March Gilt future 121.00 were not even tested. March Bund future did not Close back below the relatively elevated weekly oscillator threshold at 164.35 last week prior to beginning to push higher again; the equivalent level this week is 164.65 (basis the weekly Close.)
As such, they all appear to be maintaining aggressive up trends. As they were all reacting more so to the equities recovery than any major strong data on their recent selloffs, the decision by the equities will likely have a bit of an impact on fixed income as well.
And the foreign exchange remains a more convoluted affair, with the US Dollar Index reacting to the various central bank moves. Yet it is also still weak below its recent .9860 DOWN Break even if it held interim .9550-00 support for now. That is consistent with EUR/USD pushing back above 1.1000 area previous DOWN Break and its 1.1120-50 Tolerance, yet still not getting up to the mid-upper 1.1400 area.
The two striking developments are the pound and the yen. USD/JPY major monthly up channel 116.20 DOWN Break two weeks ago already saw it trade below interim Fibonacci and congestion support in the 113.00 area prior to recovering. Yet, last week's Close back below that level along with this week's softening from Monday morning's test leaves it still quite weak. The more major historic congestion is not until the 110.00-109.00 area, with the more recent heavy congestion in the 105.00-101.00 range from the way up in May 2013 through October 2014.
And GBP/USD is finally read acting the full impact of the potential UK exit from the European Union. The Brexit (as it is known) the years have driven it down to slightly below January's 1.4079 trading low. It is important to acknowledge that the more major historic congestion and psychological (‘big penny’) support is obviously at 1.4000. Less obvious is the importance of the 1.3655 and 1.3504 monthly trading lows from March and January of 2009 respectively. The lower of them is a 30-year trading low. Last time GBP/USD was below it was on the way back up from the 1.0463 all-time low back in February 1985 after an aggressive multi-year selloff. It is most certainly going to be very interesting from here.
The TrendView VIDEO ANALYSIS & OUTLOOK is accessible below.
The post 2016/02/23 TrendView VIDEO: Global View (early) appeared first on ROHR INTERNATIONAL'S BLOG ...EVOLVED CAPITAL MARKETS INSIGHTS.