2016/05/19 TrendView VIDEO: Global View (late)
© 2016 ROHR International, Inc. All International rights reserved.
The analysis videos are reserved for Gold and Platinum Subscribers
TrendView VIDEO ANALYSIS & OUTLOOK: Thursday, May 19, 2016 (late)
 Global View: All Markets
It was a very interesting day-and-a-half in the wake of the FOMC minutes. It is almost bizarre (once again) that after the recent stronger US economic data of last Friday into Tuesday and right after the release of the more hawkish than expected FOMC meeting minutes (see our marked up version) the data should revert to some weakness. This is being reflected in another (albeit milder) form of the same market reactions seen after the hawkish mid-September major FOMC meeting. Undoubtedly, along with the FOMC, the markets will also continue to be ‘data dependent’.
The manifestation of that Thursday morning after Wednesday afternoon’s equities weakness that was accompanied by the govvies selloff was for the equities to weaken initially. While the govvies were being bolstered by the weak international economic data, the equities still managed to rally back late Thursday. This was especially interesting after so in the US after the Philly Fed Index, which points out the continued weakness in that sector, also noted in the FOMC minutes. The “Sell in May and go away” equities psychology we noted was just getting started in April is gaining more momentum.
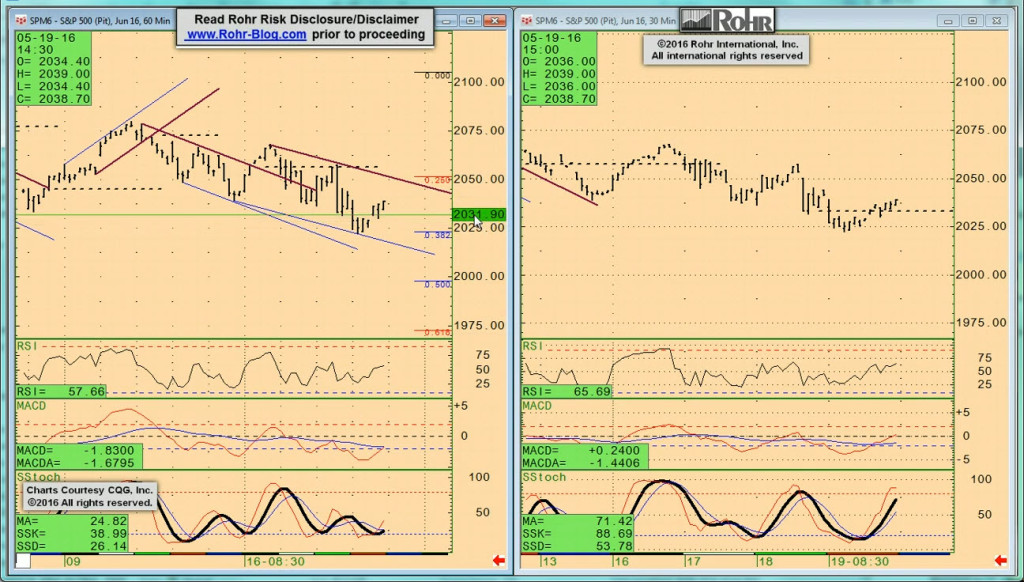
In fact, the downside momentum on the current failure below 2,035-32 was not just a new six week trading low; it is also a fresh DOWN Break from a Head & Shoulders Top with a 2,035 Neckline today. That has a (minimum) downside Objective of 1,955. It doesn’t sound all that much further down considering both August-September and in January-February it had dropped as far as the low 1,800 area. Yet the dilemma for the bulls is that (as we noted prior to each of those previous selloffs) any failure too far below 2,000 tends to range down much further. That has been at least the 1,900 area as an interim target, with the mid-low 1,800 area the more likely support.
_____________________________________________________________
Video Timeline: It begins with macro (i.e. fundamental influences) discussion of some of the factors noted above as well as quite a bit of weak economic data. In spite of strong UK Employment figures, weak Chinese MNI and US Philly Fed are signs of weakness.
It moves on to S&P 500 FUTURE short-term at 02:45 and intermediate term view at 05:00, with OTHER equities from 09:30, GOVVIES beginning at 13:15 (with the BUND FUTURE at 15:15 including implications of the early March expiration rollover) and SHORT MONEY FORWARDS from 17:15. FOREIGN EXCHANGE covers the US DOLLAR INDEX at 20:00 EUROPE at 21:30 and ASIA at 24:15, followed by the CROSS RATES at 28:30 and a return to S&P 500 FUTURE short term view at 32:00. We suggest using the timeline cursor to access the analysis that is most relevant for you.
_____________________________________________________________
Authorized Gold and Platinum Subscribers click ‘Read more…’ (below) to access the balance of the opening discussion and TrendView Video Analysis and General Update. Silver and Sterling Subscribers click ‘Read more…’ (below) to access the balance of the opening discussion.
NOTE: Back on the evening of December 8th we posted our major Extended Perspective Commentary. That reviews a broad array of factors to consider Will 2016 be 2007 Redux? For many who believe that the US economy is really strengthening and can once again lead the rest of the world to more extensive recoveries, this may seem a bit odd.
Yet there are combined factors from many areas we have been focused on since the early part of last year which are less than constructive for the global economy and equity markets. We suggest a read if you have not done so already.
We pointed out in December that in the face of another likely Santa Claus Rally this was not an actionable view during the year-end equities rally. Yet it was (and remains) important background to utilize in 2016. This is much like our major late 2006 perspective on Smooth Rebalancing? …or… The Crash of ‘07? (even though the actual crash was deferred into 2008.)
▪ The market responses to all of that strong US economic data reinforces the concerns about the overall global economic performance into the balance of 2016. Rather than simply looking at how the data is progressing, at times it is important to ask what the markets are telling us in their own right. US equities that finished last week under pressure in spite of strong data are a classical sign of a bear market shaking off near term positive data to reflect the overall trend.
Possibly even more interesting was the US govvies finishing last week three-eighths of a point higher in the face of the sort of data that would normally knock them down. Of course, that all ended in the wake of the FOMC Meeting Minutes release. Yet it still doesn’t make any sense on the short-term view for govvies to remain down if the economic data weakens once again.
And that also points up the foreign exchange anomaly of the US Dollar Index rallying on that stronger data in spite of weaker equities performance. The idea that the stronger data might leave some feeling the Fed will indeed be within its rights to raise rates sooner than not does not fit with the govvies resilience. That said, the late Thursday rebound in the equities still creates a very critical picture for Friday’s weekly Close.
Based on the June S&P 500 future topping pattern noted above, if the equities are lower Friday in spite of that late Thursday rebound it will be a very weak indication. If they rally further instead, they might still be bearish overall, but the near term price activity will favor one more upside swing. While that might be part of a broader topping action, it will not likely assist the govvies or weigh on the US dollar in the near term.
▪ This all still fits in with the broader scenario we have anticipated for a while. Recent equities weakness in spite of the still quite accommodative central bank positions outside of the US is likely the denouement of the extended multi-year central bank efforts to rescue economies that climaxed in the recent US equities rally. Yet that was without essential assistance from structural reforms from the political class. As emphasized ever since our February 9th Fear & Loathing in Marketland post:
The next financial crisis will occur when the investment and portfolio management community (and ultimately the investing public) realizes that the central banks alone cannot restore the robust growth from prior to the 2008-2009 financial crisis.
The weakness for some of the major developed economies in the most recent OECD Composite Leading Indicators is another sign that years (and in Japan’s case decades) of QE and recently sustained very low interest rates are not restoring the robust growth from prior to the 2008-2009 financial crisis.
The extensive analysis of the broader ‘macro’ background in previous posts (especially the Thursday, April 28th Special Alert: Equities Critical) has already explored all of the reasons the equities might be at the top of a more major bear phase, and we refer you back to those for that insight. That Thursday morning Special Alert: Equities Critical also refers back to more meaningful previous ‘macro’ analysis of the economic data, central bank efforts, and the risks in the lack of structural reform from the political class.
The TrendView VIDEO ANALYSIS & OUTLOOK is accessible below.
The post 2016/05/19 TrendView VIDEO: Global View (late) appeared first on ROHR INTERNATIONAL'S BLOG ...EVOLVED CAPITAL MARKETS INSIGHTS.