2015/12/08 Commentary: OECD Composite Leading Indicators (early)
© 2015 ROHR International, Inc. All International rights reserved.
Extended Trend Assessments reserved for Gold and Platinum Subscribers
COMMENTARY (Non-Video): Tuesday, December 8, 2015
Commentary: OECD Composite Leading Indicators (early)
 Rose colored glasses. It would seem the Organization for Economic Cooperation and Development has a major stash of these for use by the writers providing the brief descriptions at the top of each month’s Composite Leading Indicators (CLI.) There is sharp contrast between their characterization of growth in some centers and what is apparent from the accompanying graphs. While there is a tendency to maintain an upbeat tone, after last month’s major semi-annual Economic Outlook (which included November’s CLI) was so negative on the global outlook, we expected OECD might be a bit more realistic about the overall state of things.
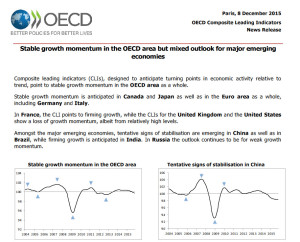
This month’s CLI was released this morning, and the economic weakness projected in some key countries on the graphs is in sharp contrast OECD’s desire to characterize it as stable. While we always recommend opening the full report to see the extended graphs and tables, for now we suggest clicking into the opening graphic at the top of this post to see the most telling example. (Best to right click and open in a new window if you want to remain in the post.)
Note that it states “Stable growth…” in the OECD area. Yet a look at the left hand graph seems more like there was stable growth into the beginning of 2015, and it has been steadily deteriorating. Another interesting indication is the ‘Year on Year change’ in the table on page 3. Outside of the Euro-zone the deterioration is even more apparent. Especially note the extent of the weakness in the UK and North America.
[There is a brief update of the technical trend activity this morning in the Extended Trend Assessment in light of the significant overnight price movement in some markets.]
Authorized Silver and Sterling Subscribers click ‘Read more…’ (below) to access the balance of the opening discussion. Non-subscribers click the top menu Subscription Echelons & Fees tab to review your options and join us. Authorized Gold and Platinum Subscribers click ‘Read more…’ (below) to also access the Extended Trend Assessment as well.
[NOTE on the nature of the forward view from the OECD Composite Leading Indicators: These are presented as six month forward view. However, the OECD rightfully waits for the data to mature for a couple of months prior to issuing its forecast. The current release is for October. As such, in practice this becomes a de facto four month forward view. That is of course still very useful. The received wisdom on the equities trend activity is that they operate on a 90-180 anticipatory view. As such, any relatively effective leading indication four months into the future can be an effective adjunct to other analyses.]
▪ As you can review it for yourself, we will not spend too much more time reviewing this month’s CLI release. Suffice to say there are a couple of more clear discrepancies between the characterization of the momentum and the accompanying graphic. Most notable are German growth momentum being designated as ‘stable’ when the graph seems to show weakness after the mid-2015 improvement, and a very similar indication for Japan.
▪ Prior to moving on the technical trend discussion in the Extended Trend Assessment we also want to revisit that rather negative previous OECD major indication. We refer to this as the “OECD Trade Fade” in the far more extensive review and outlook we will be posting later today. After the strong early November US Employment report it was a fairly striking to see the OECD (Organization for Economic Cooperation and Development) Economic Outlook and Interim Economic Outlook the following Monday morning (November 9th.)
The reason it includes the interim view as well is as noted above: the incorporation of monthly Composite Leading Indicators (CLI) into this major semi-annual assessment. It was quite downbeat, mirroring the slippage into atypical negative outlooks in all of its recent monthly CLI.
And there are two areas which seem most crucial to the anticipation out of 2015 into as least the early part of 2016 are economic weaknesses we have noted previous. The first is the telling sharp contraction in international trade. The second is the political class’ lack of desire or ability (take your pick) to provide the structural reforms necessary to complement the previous and ongoing massive Quantitative Easing programs of so many central banks.
Especially of note is the slideshow (enlarge to full screen) and the video of the Outlook presentation. Of particular interest in the press conference video discussion by Secretary General Angel Gurria and others is the focus form approximately 03:00 on the extreme weakness of global trade (we have noted previous), and (from 05:15) the fact that structural reform we have been so focused on all year is the only policy lever left after monetary and fiscal tools have been mostly exhausted.
That is increasingly important in the context of the significantly diminished global trading volumes. Global trade that had been growing slowly over the past few years now it seems to have gone completely stagnant, growing only 2.00% in 2015. The rule of thumb is that trade grows at double the rate of global economic growth. And here’s the rub:
Over the past 50 years there were only five years where trade growth was 2.00% or less. Each of those coincided with a marked downturn in global growth. 2016 may turn out to be the exception, but the historic context is not propitious. Especially as future growth is expected to be subdued, even the extended outlook into 2017 and 2018 is not very strong. And that is the sort of thing on which businesses base investment and hiring decisions. There is also little chance that the political class in the US will engage in any constructive compromise on badly needed structural reforms into an election year.
▪ A final word on the current background for highly volatile markets right now prior to the critical near-term trend review in the Extended Trend Assessment. It is worth mentioning the ‘macro’ background for the current dislocations in the equities (and only then review the other markets below.)
While it was quite a strong finish back above 2,080-75 on Monday, the December S&P 500 future falling not just below it this morning but also cracking next support in the 2,060-58 area as well is a negative sign. Yet this all seems part of the Agony & Ecstasy whipsaws as we get into the holiday period.
Santa Claus may still show up to bolster the equities, but for now the markets have had only a lump of coal in their stocking… literally. The weakness of commodities highlighted by Crude Oil weakness is hurting some significant sectors of the major equities indices. Obviously mining and oil production are big industries, and the equities needs to take their additional pain seriously.
However, as we have seen on quite a few occasions, cheaper commodities are NOT a long term drag on the global economies or equities markets. The problem right now is that NYMEX Crude Oil futures that have traded below August’s 37.75 lead contract low (October at the time) can continue lower for a while. That is a new seven-year low, and next lower historic congestion is not until the 35.00 and 32.00 areas. This would seem to call for a very agile and selective view of the equities as well until Crude Oil has bottomed.
This is now a question of whether there is any sustained violation of the 2,060-58 area, or the December S&P 500 future manages to recover back above it. If it does weaken further the classical interim support at 2,040-35 and far more major 2,020-10 area remain the key lower technical levels.
The COMMENTARY Extended Trend Assessment is accessible below.
The post 2015/12/08 Commentary: OECD Composite Leading Indicators appeared first on ROHR INTERNATIONAL'S BLOG ...EVOLVED CAPITAL MARKETS INSIGHTS.


